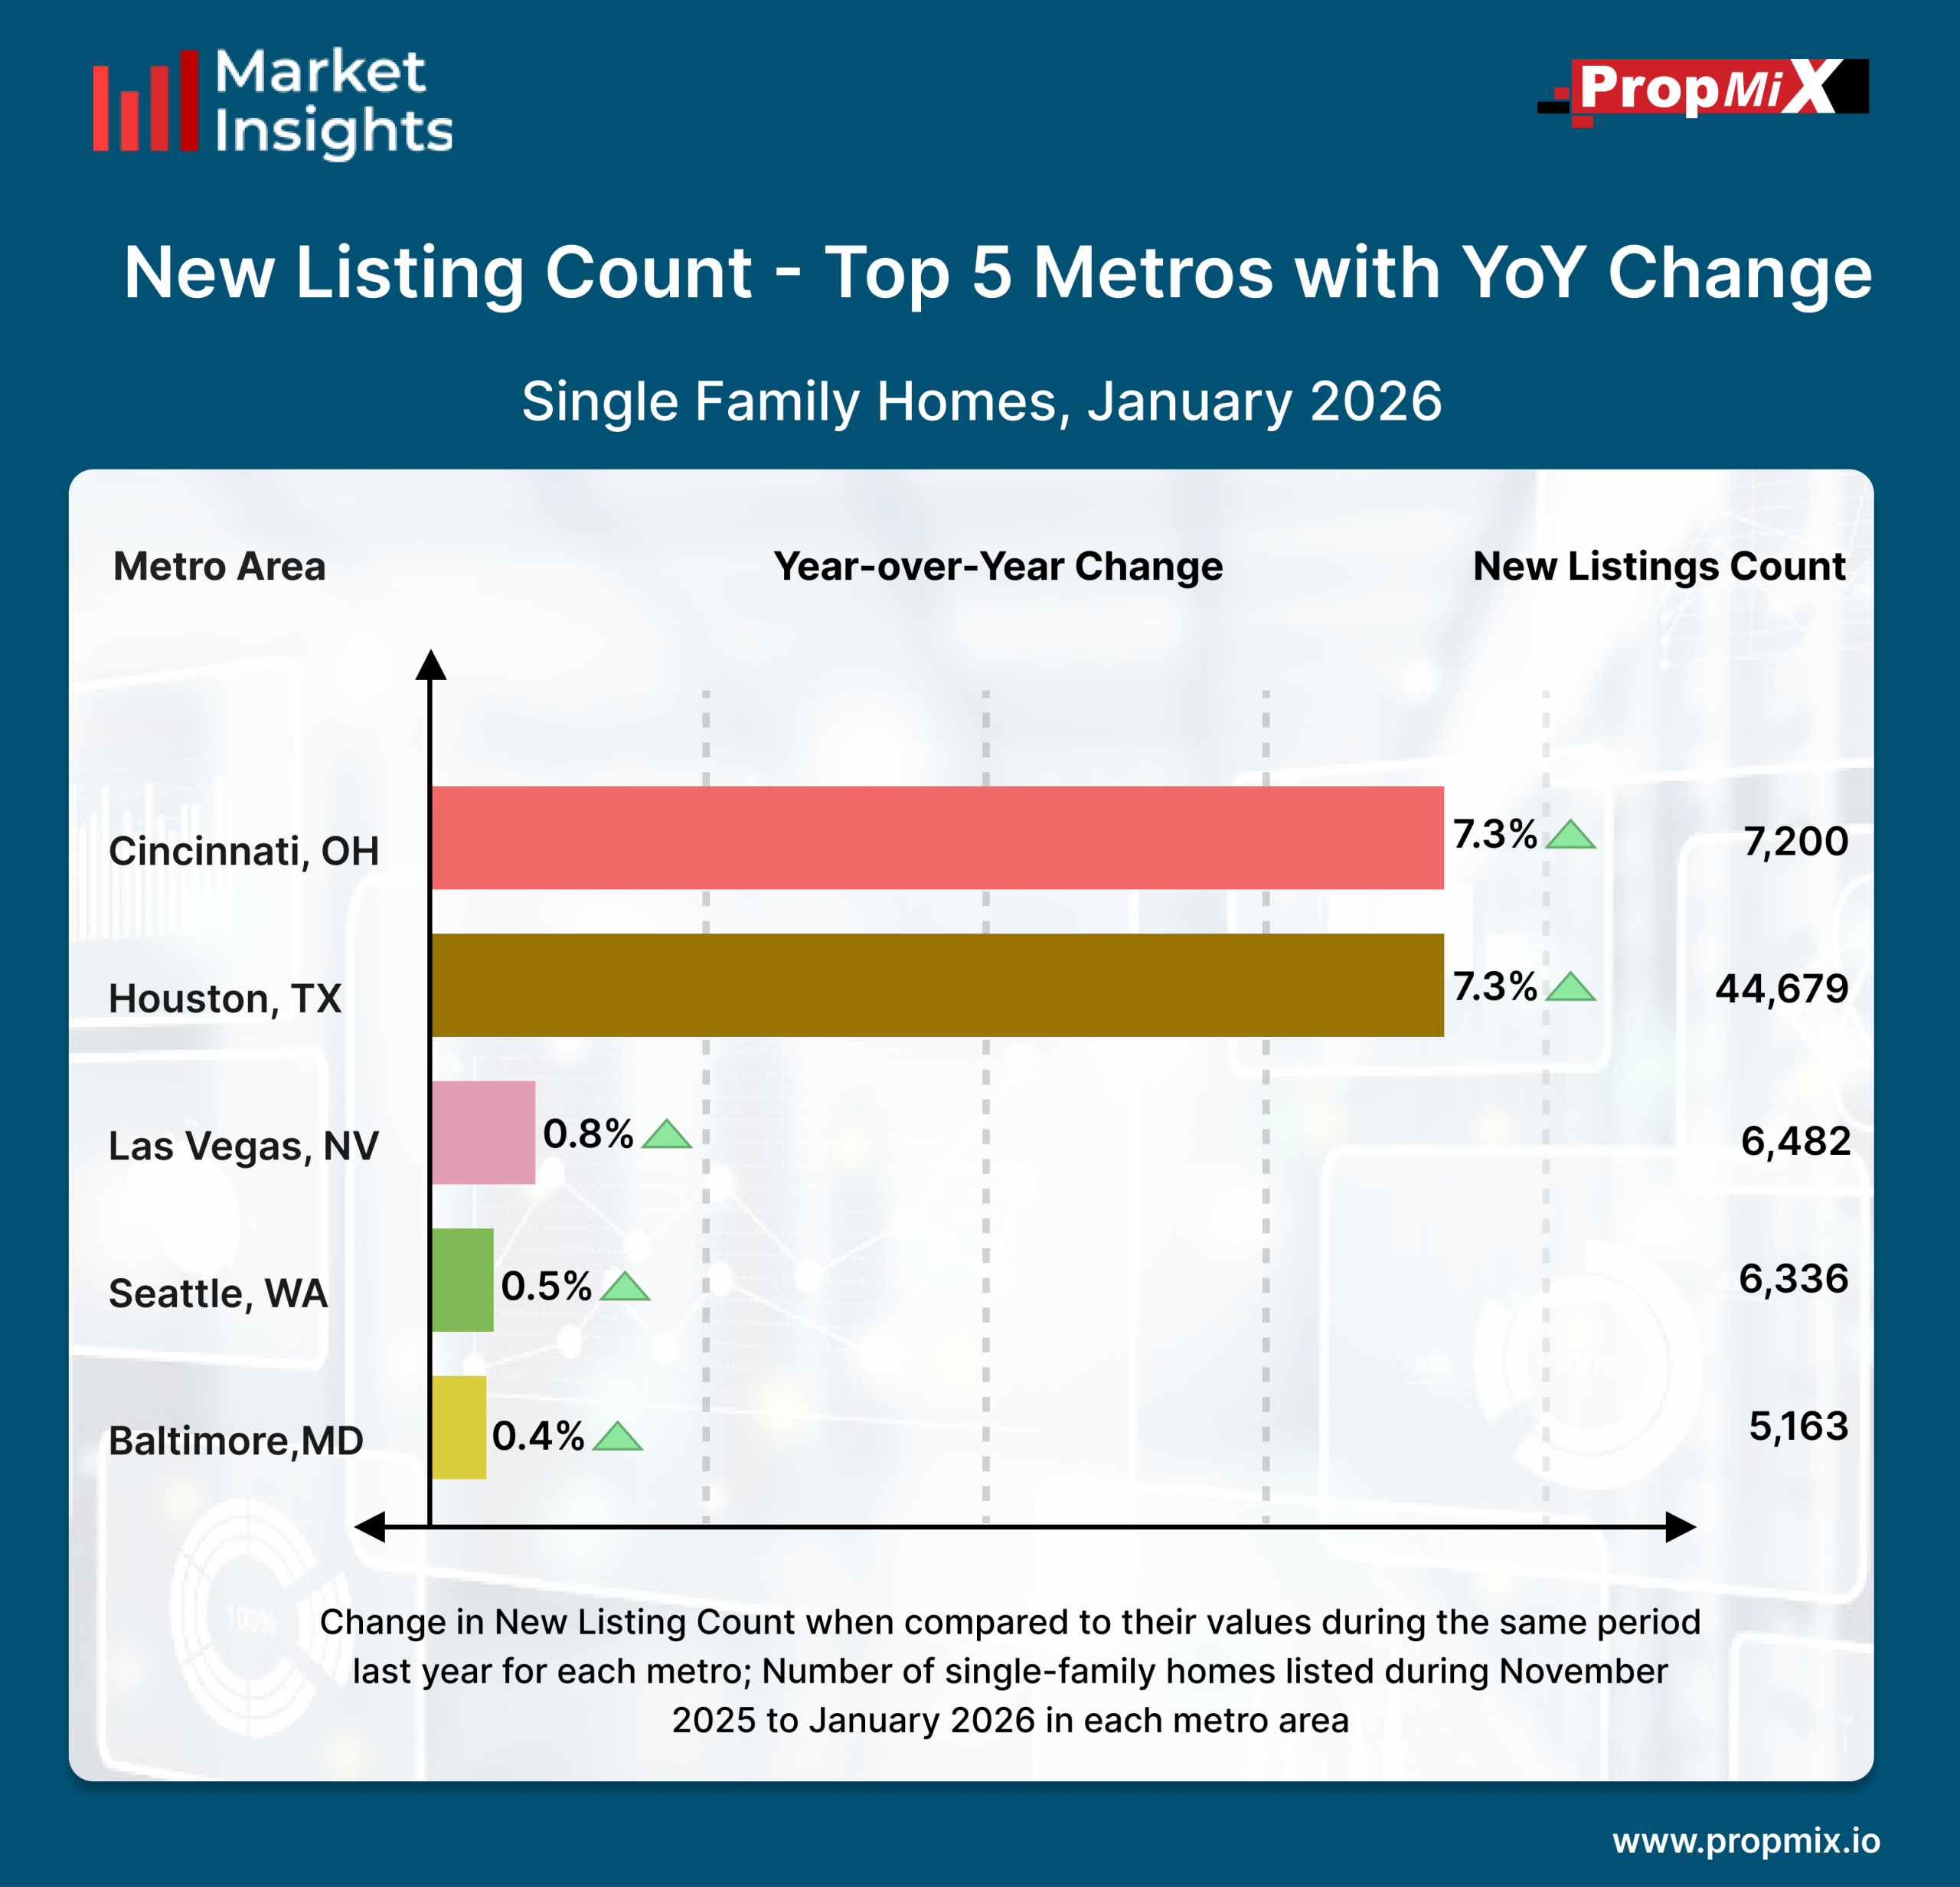
January’s new listing data shows measured year-over-year growth across several major metro areas. While increases were stronger in select markets, others experienced relatively modest gains, reflecting varied regional supply dynamics at the start of 2026.The Houston, TX metro led the group with 44,679 new listings, reflecting a 7.3% YoY increase. Cincinnati, OH followed with 7,200 listings, also posting a 7.3% annual rise.Las Vegas, NV recorded 6,482 new listings, up 0.8% YoY, while Seattle, WA saw 6,336 listings, marking a 0.5% increase compared to last year.Baltimore, MD rounded out the list with 5,163 new listings, reflecting a 0.4% year-over-year gain, indicating relatively stable listing activity compared to January 2025.
For a detailed view of all 30 metro areas that we track and more insights, visit our Interactive Market Insights page. Learn more about the metrics in PropMix Market Insights.