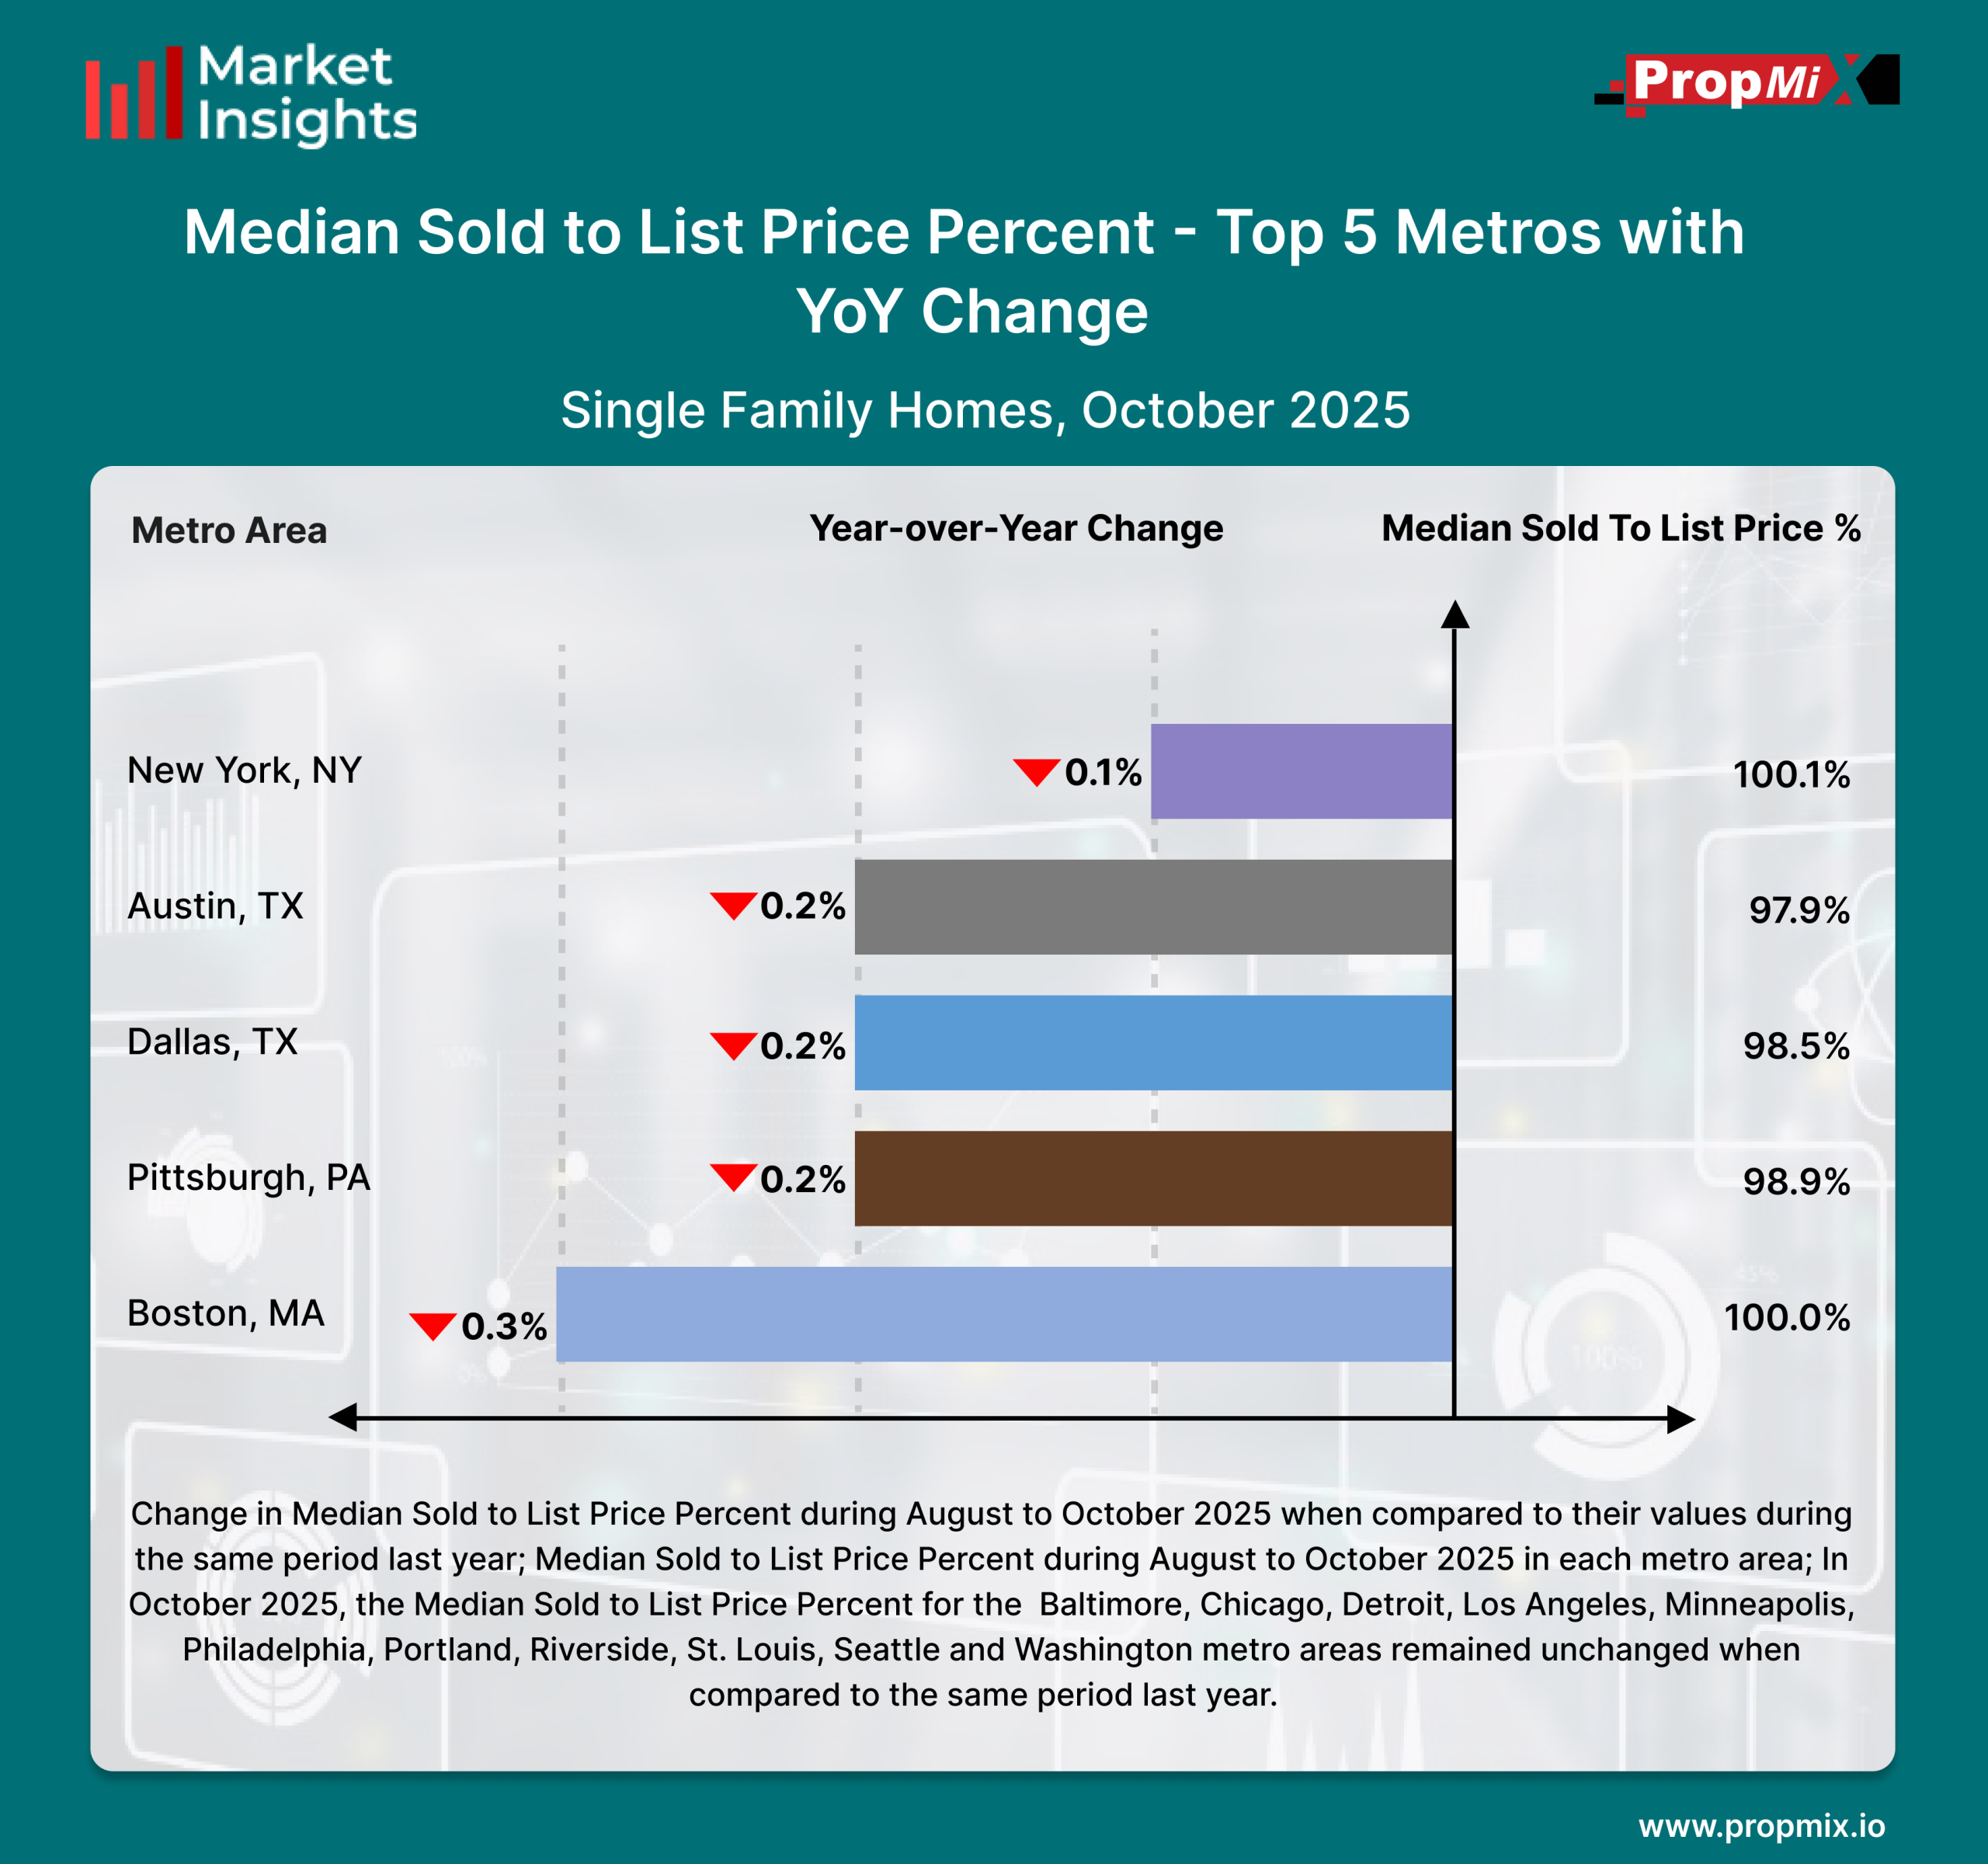
Among the top U.S. metro areas, New York led October 2025 with a Median Sold-to-List Price Percentage of 100.1%, experiencing a slight 0.1% year-over-year decline. Despite the dip, it remained the strongest-performing metro in terms of seller pricing power.Boston followed closely at 100.0%, though it posted the largest decrease among the top metros, down 0.3% YoY.Pittsburgh and Dallas both recorded 0.2% YoY declines, with their Median Sold-to-List Price Percentages standing at 98.9% and 98.5%, respectively.Austin also slipped 0.2% YoY, ending the month at 97.9%, reflecting continued softening in the Texas market. In contrast, several key metros including Baltimore, Chicago, Detroit, Los Angeles, Minneapolis, Philadelphia, Portland, Riverside, St. Louis, Seattle, and Washington, D.C.showed no year-over-year change during the August–October 2025 period, holding steady relative to last year.
For a detailed view of all 30 metro areas that we track and more insights, visit our Interactive Market Insights page. Learn more about the metrics in PropMix Market Insights.