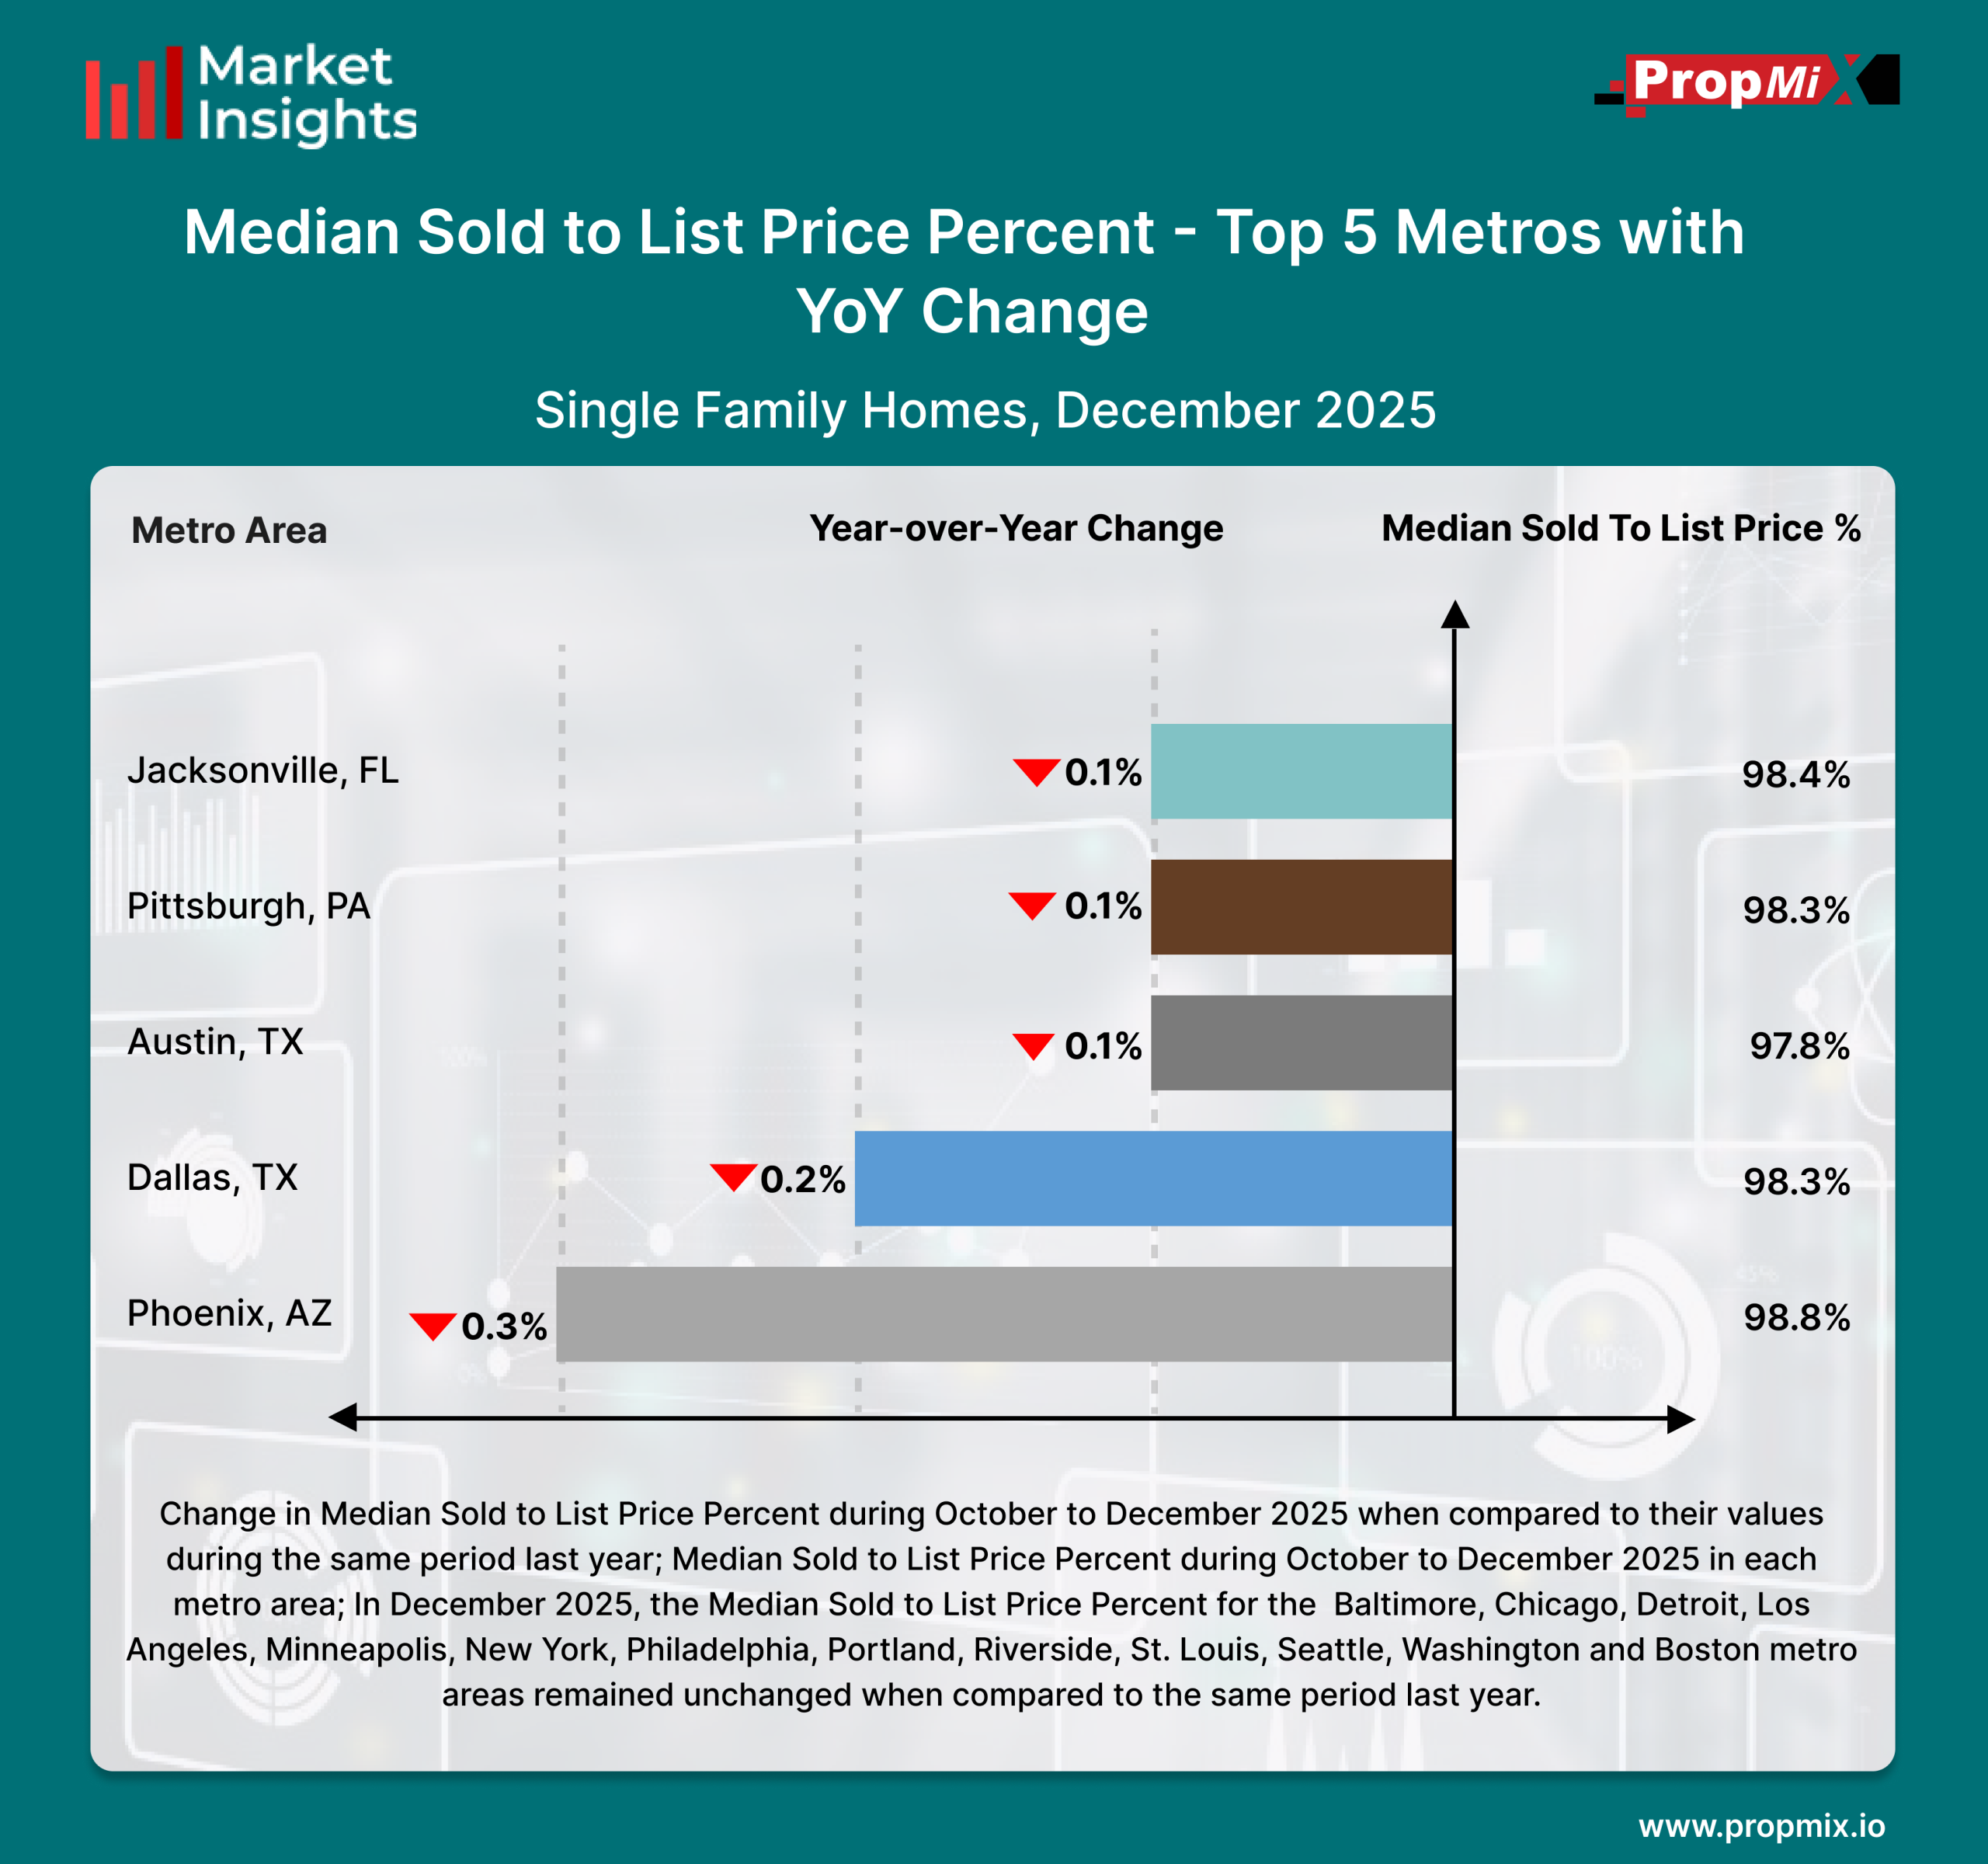
December 2025 data compares how median sold-to-list price ratios in select U.S. metro areas differed from the same month last year. Phoenix posted the highest ratio among the top metros at 98.8%, despite a 0.3% year-over-year decline, the largest decrease in the group.Jacksonville followed with a Median Sold-to-List Price Percentage of 98.4%, reflecting a 0.1% YoY decline. Dallas recorded a 0.2% year-over-year decline, with homes selling at 98.3% of list price. Pittsburgh also reported 98.3%, down 0.1% compared to last year, while Austin registered 97.8%, reflecting a 0.1% YoY decrease.Across the October to December 2025 period, several major metro areas including Baltimore, Chicago, Detroit, Los Angeles, Minneapolis, New York, Philadelphia, Portland, Riverside, St. Louis, Seattle, Washington, D.C., and Boston showed no year-over-year change, remaining in line with the same period last year.
For a detailed view of all 30 metro areas that we track and more insights, visit our Interactive Market Insights page. Learn more about the metrics in PropMix Market Insights.